
20.12.2018
Santa and the yield curve
Sarah Goose, Portfolio Manager, Responsible Investment Lead

Sarah Goose, Assistant Portfolio Manager
In 17 of the past 20 years the FTSE 100 has stood higher on New Year’s Eve than at the beginning of the month, when people began opening their advent calendars. One suggested explanation for the pattern is that it is simply the result of bullish investors imbued with festive optimism. Another is that an influx of end-of-year bonuses drives up prices.
The average rise is just over 2% (though in each of the past two years it has been over 5%). It has become such a common phenomenon that it has earned its own epithet – “the Santa rally”.
Santa Rally 2018?
Will this year be one of the exceptions? The FTSE 100 has fallen by more than 3% in December so far, with the ongoing Brexit debate and the US-China trade wars dragging down the mood. Something else may have been at play, too – the flattening yield curve.
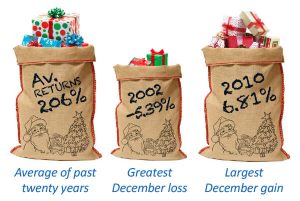
Santa rally numbers: December total returns posted by the FTSE 100 in the past twenty years (Source: Bloomberg, to 31st December 2017) Past performance is no guarantee of future performance
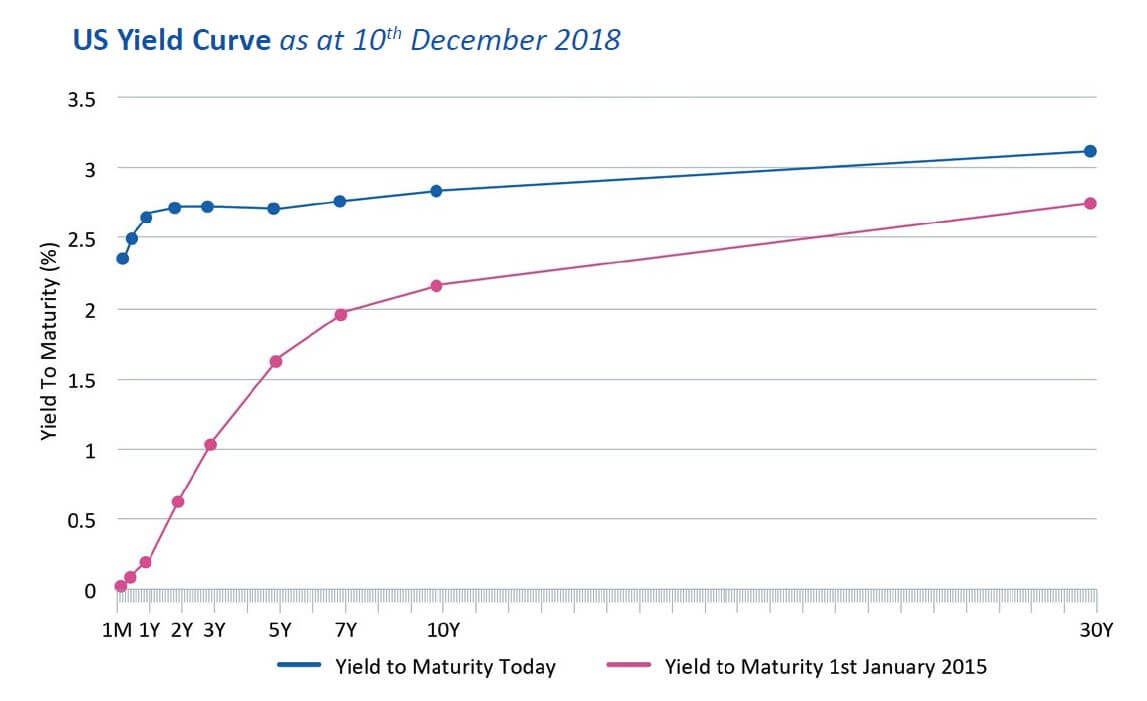
This is worth spending a moment to understand. The yield curve plots bond yields of varying maturities – for instance, the return investors can achieve by lending to the US government over different periods of time through the purchase of US government bonds.
While many theories seek to explain the shape of the yield curve, we can presume that under “normal” conditions the longest-dated bonds (to the right when viewed on a chart, below) offer a higher reward than their short-dated equivalents (to the left). That makes sense – they do not mature till later (perhaps a long time later), by which time a return that looks attractive in today’s low-inflation, low-interest-rate environment may look positively puny or even punitive.
When an economy is growing strongly and investor confidence is high, the yield curve tends to reflect this with a more steeply upward slope, embodying the expectation that interest rates and inflation will rise in the future as the economy heats up.
So the yield curve can tell us a great deal about investors’ predictions of the economy’s direction of travel. It is such a good barometer of sentiment that moves in the yield curve can arguably fuel or dampen the mood.
Flattening yield curve
This month the yield curve has flattened, which is often viewed as a sign of investor anxiety. The difference between two-year and 10-year US government bond yields fell to less than 12 basis points (or 0.12%). This is an 11-year low. The big worry is that the yield curve will actually invert – so that the yields on short-duration bonds are higher than on their longer-duration peers. This is something that has preceded every US recession since 1945.
We are clearly experiencing a conflict of emotions – seasonal joie de vivre, which usually drives markets up, and end-of-cycle anxiety, driving them down.
It is a reminder that markets are still – for now at least – largely driven by humans. And that means they are still susceptible to mood swings and bouts of irrationality.
It is difficult to see an outcome of the Brexit scenario that might emerge to put markets in a festive mood. We think 2019 will see emotions continue to run high and markets experience more volatility.
But volatility is not necessarily a bad thing for long-term investors. We have positioned portfolios defensively, but we are ready to use market volatility to purchase securities at prices we believe are attractive on a long-term view.

20 December 2018
You should not act on the content of this market commentary without taking professional advice. Opinions and views expressed are personal and subject to change. No representation or warranty, express or implied, is made of given by or on behalf of the Firm or its partners or any other person as to the accuracy, completeness or fairness of the information or opinions contained in this document, and no responsibility or liability is accepted for any such information or opinions.
The value of an investment and the income from it can go down as well as up and investors may not get back the amount invested. This may be partly the result of exchange rate fluctuations in investments which have an exposure to foreign currencies. Fluctuations in interest rates may affect the value of your investment. The levels of taxations and tax reliefs depend on individual circumstances and may change. You should be aware that past performance is no guarantee of future performance.